How to get started with Data Analysis using pandas

Introduction
Data Analysis is a family of statistical methods that aim to extract useful information from data to make better business decisions. Several tools are used to do data analysis and among them, there is pandas. This article is for beginners who just started with data analysis with pandas. Through this article, you will be able to learn :
- What pandas is?
- What is this tool used for?
- How is it used?
- How to start data analysis with pandas: a practical example
Prerequisites
To be able to practice the different tasks of this tutorial, you will need :
- A jupyter notebook environment installed on your computer
- A working terminal
- A dataset downloadable here
What is pandas?
Derived from the term "Panel Data" which is an econometrics term for multidimensional structured datasets according to Wikipedia, pandas is a powerful Python Data Analysis Library. It is a data analysis and manipulation tool with these characteristics :
- Open-source
- Fast
- Flexible
- Powerful
- Easy-to-use
What is pandas used for?
Built on top of the Python programming language, pandas is mainly used for Data Analysis. Apart from allowing file importation in CSV, EXCEL, JSON or SQL formats, pandas is also used to perform data collection, data cleaning, data wrangling and various data manipulation operations such as :
- merging
- selecting
- deleting
- reshaping
In simple terms, pandas is a tool used for cleaning data inside a dataset to extract better insights and make great decisions.
How is pandas used?
Previously, you learnt that pandas is a python package used for data analysis. It is not a setup you can run or install on your laptop. pandas is a python library that needs to be opened in a given work environment like a Terminal, IPython, Google Colab or Jupyter Notebook which will be used for this tutorial.
Firstly, let's assume that you are using Jupyter Notebook. Then, you just have to import the pandas library. Once the library is imported, you can start using the different methods provided. To import pandas in your environment, type :
import pandas
A practical example of pandas use
In this part of the tutorial, you are going to see how pandas is used to do some data analysis stuff. It will be divided into many steps that will guide you through the practical use of the pandas library.
Step 1: Download the dataset
A dataset is made of structured, unstructured or semi-structured data from which you can draw meaningful insights. It can be a file, most of the time an excel file or a CSV file with a wide range of data you can work with. The dataset you will use in this tutorial is available here. For you to be able to download it, you need to register and have access to more datasets to practice.
Dataset description
This dataset ( a csv file) is about some features of windows applications installed in the Microsoft store. It contains five (5) columns :
App_Order: The store order of the application.
App_Name: The name of the application
App_Star: The average score received by the app.
App_Price: The sale price of the app in the store.
App_Review: The number of times the app was viewed in the store.
Step 2: Open Jupyter Notebook
Jupyter Notebook is the environment in which you will work throughout this tutorial. To open your jupyter notebook :
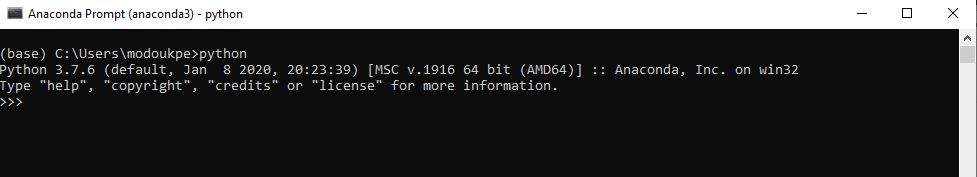
- Make sure you have python installed on your computer (To check that, you can type python in the terminal and click Enter. If Python is installed, then you will see the version and the prompt, ready to execute instructions like on the following image.)
- Go to any of your terminals and open it
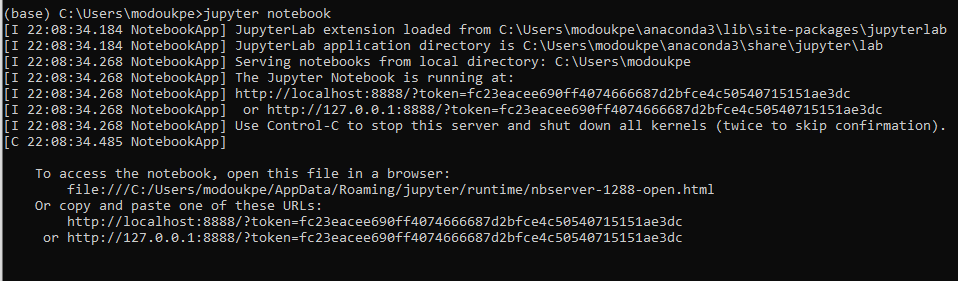
- Type jupyter notebook and click Enter
Some information will progressively appear on your terminal. Take a look at the next picture to have an idea and make comparisons with what you have on your end.
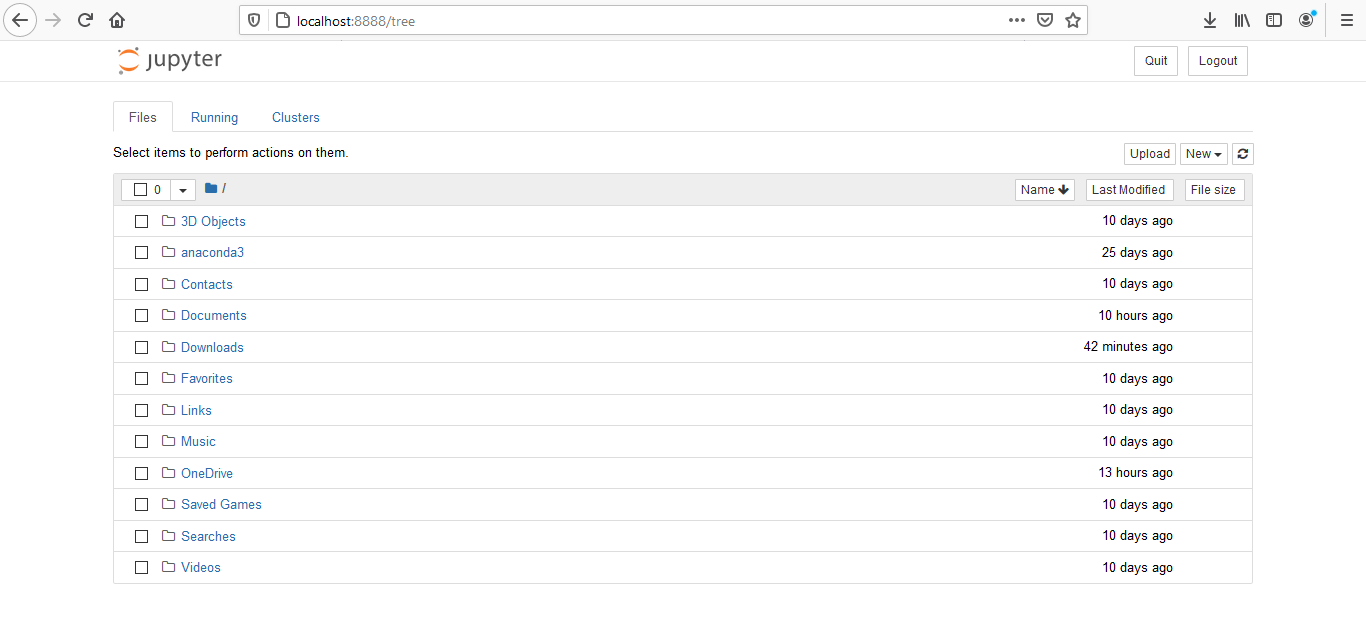
If the last step works properly, then you will be redirected to your default browser on a page showing the jupyter notebook environment, which looks like this :
Step 3: Create a new file in the jupyter notebook
You will have to create a file in which you will work.
In the right corner :
- Click on New
- Select Python 3
- Choose your directory and save the new file Next, you can decide to rename your file or not.
Step 4: Apply some methods to the downloaded dataset
Several methods are applied to a dataset to get useful insights. You will learn some of these.
- Read a file
The first lesson you are going to learn in this part is how to read a dataset from a file. But before, you need to import pandas, just like this :
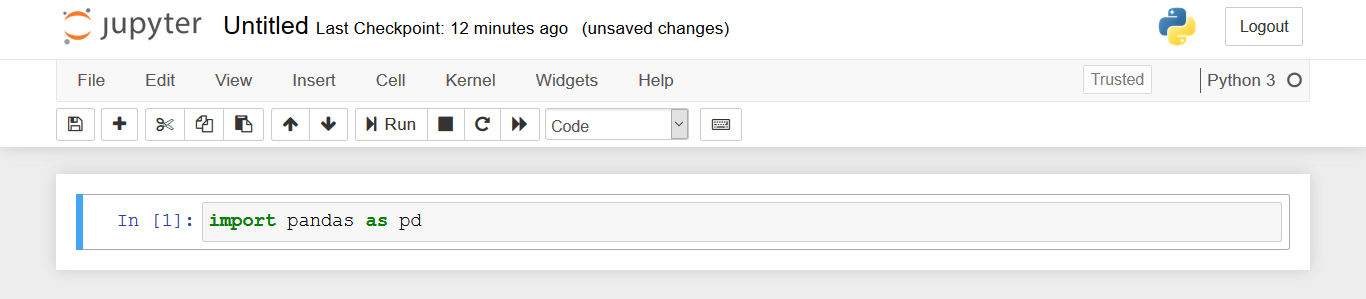
In that instruction, note that pd is just an alias. You can name with whatever you want but the one which is commonly used is pd.
Then, make sure you know the path to the dataset you downloaded previously. Finally, type the following on the next line and click on Run.
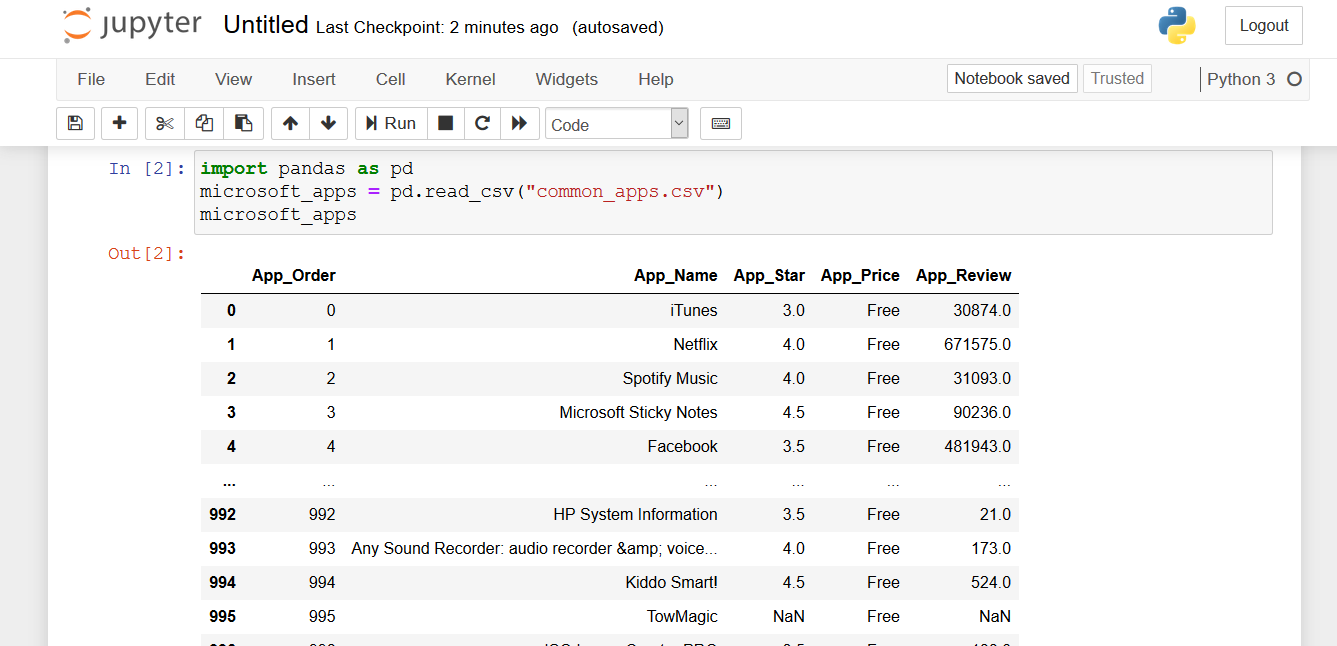 As you can notice, the dataset's content is displayed in the next row.
microsoft_apps is a variable inside which you capture the dataset's content. Once again, you can name it as you want. The last line is used to print out the content of the dataset.
- Know the number of rows and columns in your dataset
To check the number of rows and columns in your dataset, use the shape function. Take a look at the next picture.
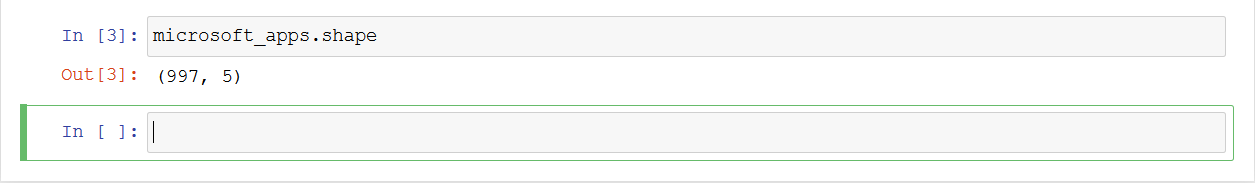
Note: Do not forget to click on Run if you want to execute your instructions.
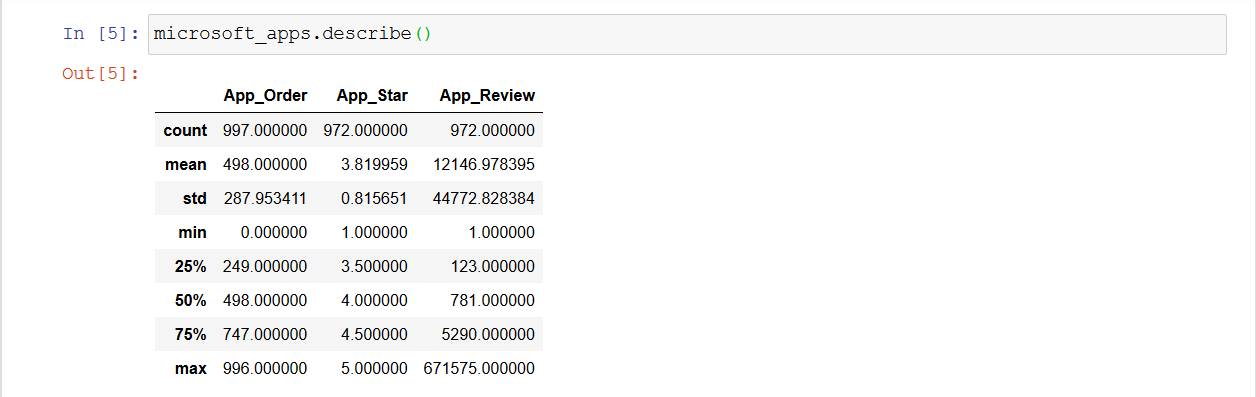
- See some statistical elements about the dataset
If you want to display some statistical features of your dataset, use the describe function, like on the image below.
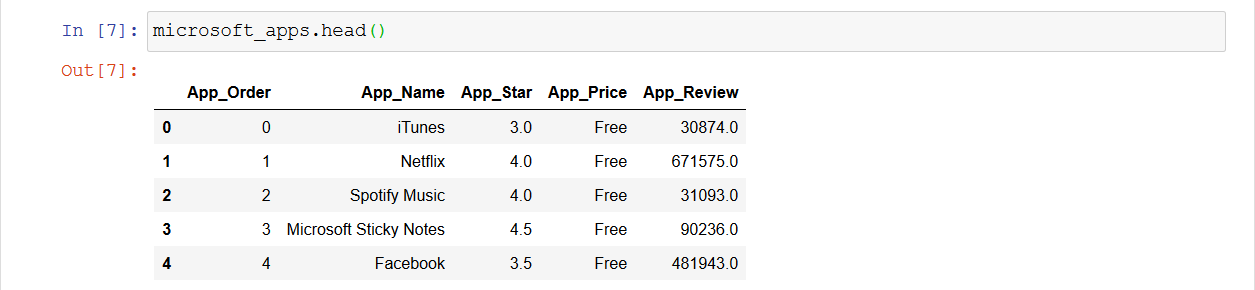
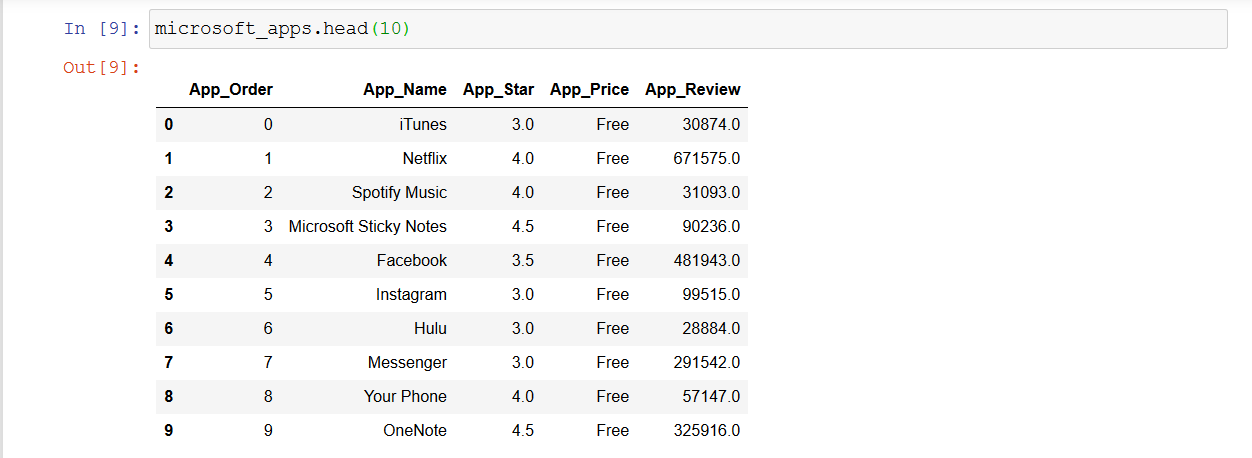
- Display the first rows of your dataset
There is a special function used to display the first rows of a dataset. By default, it shows the five first rows of the dataset. This function is called head and is used like this :
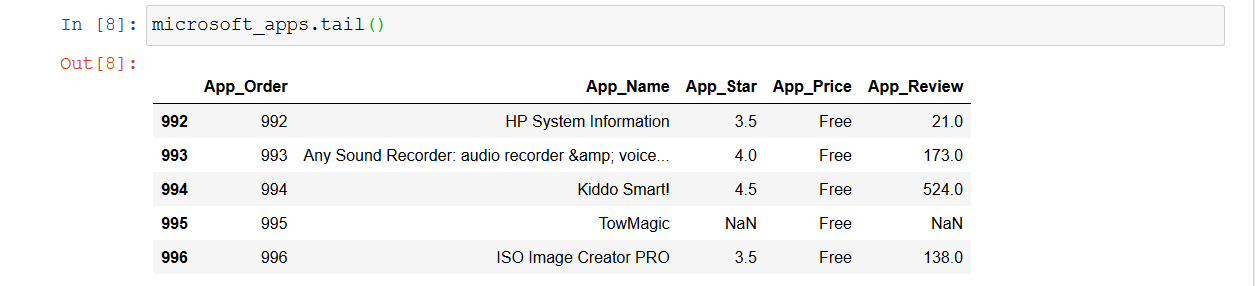
- Display the last rows of your dataset
If you want to display the last rows of your dataset, the adequate function for this is called tail. By default, this function also displays the last five elements of a dataset.
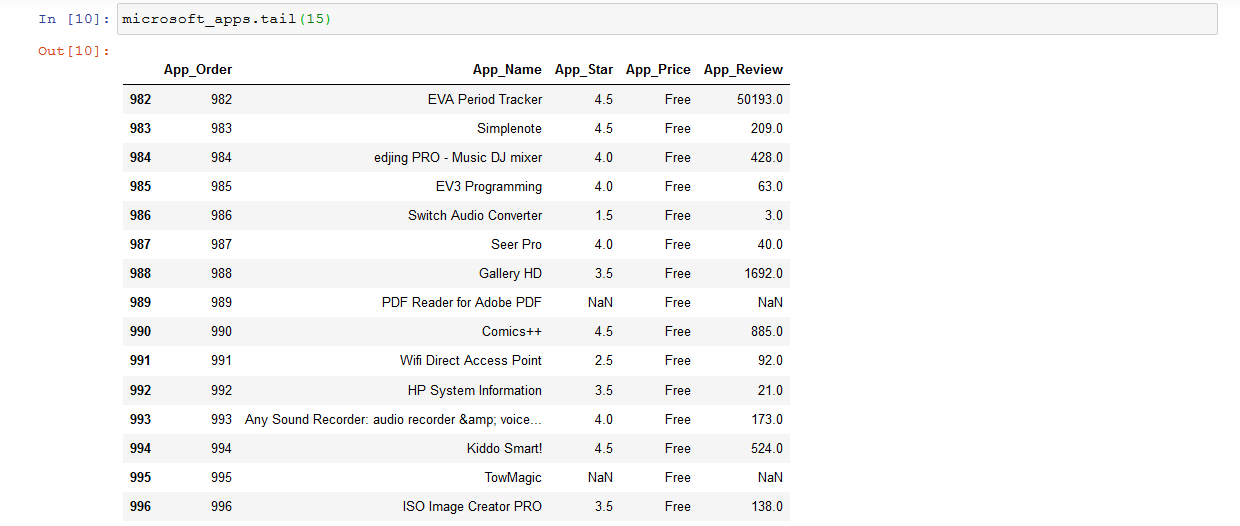
If you want to display the first ten rows or for instance the last fifteen rows, you can still use those functions but there is a particularity. You need to specify the number of rows in brackets. Have a look at the next screenshots.
- Display the different columns of your dataset
You can know the different columns in your dataset by using an attribute named columns, like what you see in the picture below.

- Display the different columns of your dataset in a list
It is possible to convert the result of any request you make into a list. This is done by using the tolist() method. You will notice that there is a difference compared to the previous request. The image below illustrates it:

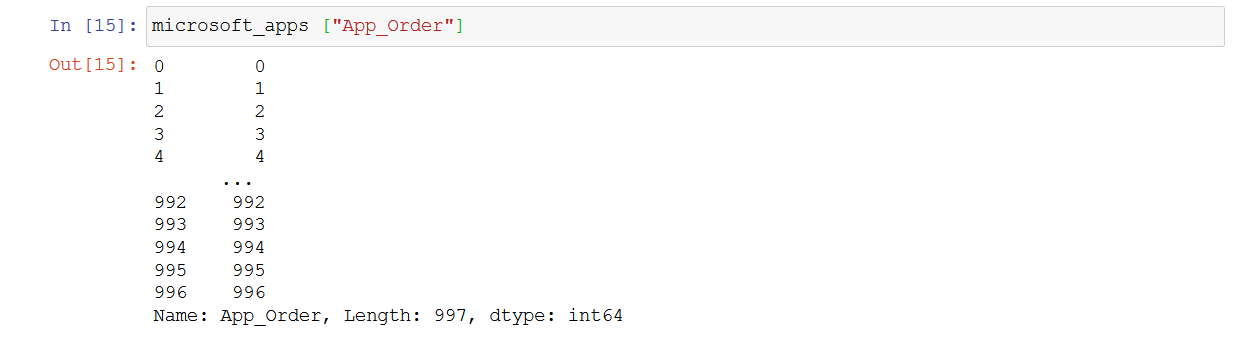
- Display the content of a particular column
With pandas, you can display the content of a specific column. For that, you need to specify the column in the square brackets as it is done in the next screenshot:
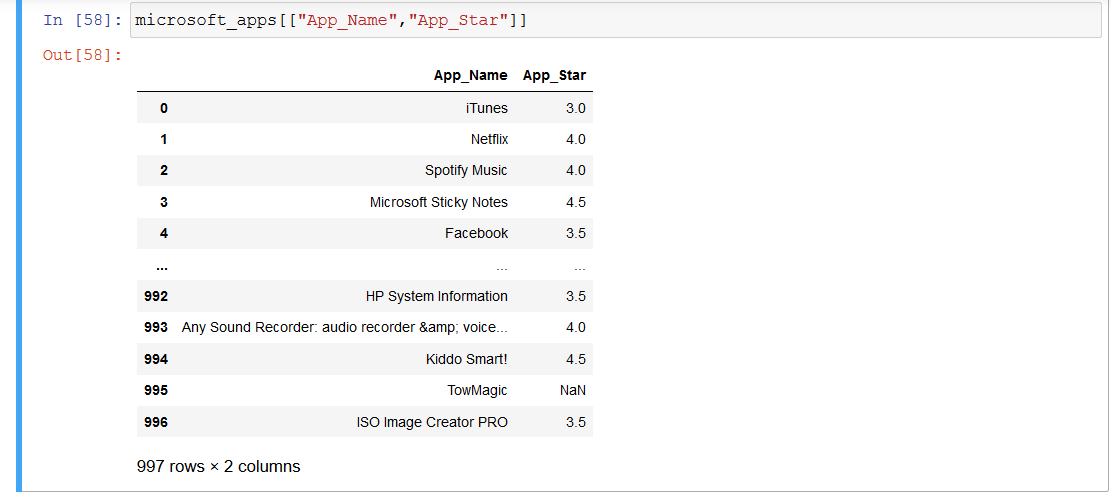
- Select more than one column at the same time
To select two or more columns and capture their content, you can proceed like this :
- Select a specific range of data
Sometimes, you may not need to display the first five or the last ten rows of your dataset but a specific range of data. For instance, you want to display entries from the twelfth to the sixteenth row. To do this, you can use the indexation, as shown in the picture below.
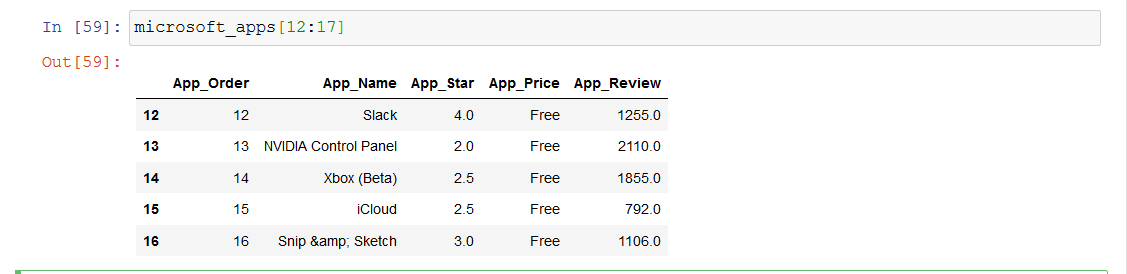
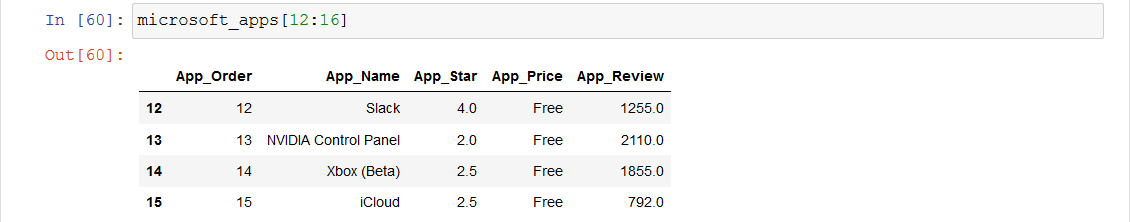
The last element index is not included which means that if you need to capture data from row 12 to row 16, you should not put 16 as your last element in the square brackets but 17; otherwise you will only get data from row 12 to row 15 like this:
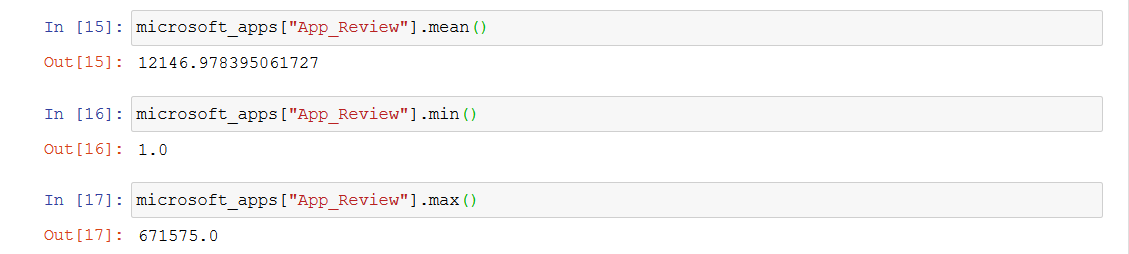
- Get the mean, the min and the max of a specific column
These statistical functions are only applied to arithmetical columns. In this case, the App_Review column is eligible. Here is how you can display these features:
Documentation
If you want to learn more about data analysis and tools used, you can have a look at some of the resources listed below :
- A beginner's guide to data analysis in Python
- A Data Analysis course from Freecodecamp
- Learn more about the pandas library
Conclusion
Pandas is one of the powerful tools used in data analysis. It is open-source and easy-to-use especially for the beginners in data analysis. This tutorial teaches how to get started with data analysis using pandas.
Hope you find this article useful!
Do not hesitate to drop your comments in the comments section if you have any.
Stay Safe !!!


