Starting my journey in data science : How to handle missing values ?

Introduction
As I started my career in data science, I encountered some difficulties especially when it comes to deal with missing values in a dataset. I was always asking myself what could be the best solution for a great analysis. In fact, It took me a long time to discover two methods which are very useful to handle missing values in datasets.

Asking myself a lot of questions about missing values
The questions I usually ask myself are : Could I proceed with the analysis even if there are some missing values ? Is this going to help me to get great and valuable insights from the datasets ? Through my searches, I found out that the answer is No. No, because a dataset has to be cleaned before anyone can proceed to its analysis. Otherwise, almost all the insights coming from this dataset will probably not be reliable.
Today, I have decided to write this article about two ways to handle missing values in datasets, not only for people who are struggling with that but also as a reference for myself (Because I experienced this before and if it happens again today, I should be able to manage it thanks to this article). So, I will show how they are used and what could be the consequences of using them on datasets. Besides, I will also give my own opinion about these methods and which one I recommend using.
How to handle missing data/values ?
In this part, we are going to work on a simple dataset that contains some missing values and we will try to manage them step by step.
Let's start with the meaning of missing data
Missing data can be defined as the values that are not recorded in a dataset. It can be observed on qualitative (for example the category of a book) as well as quantitative data (the victims of Covid-19 per country). Missing data can only concern either a single cell or an entire observation (a row).
Next, let's see the content of our dataset
Our chosen dataset is about raw materials properties and can be downloaded here. Specifically, there is a lot of plastic pellets whose characteristics are measured. But the most important here is to have a look at how missing values are handled.
Here, we will use the Pandas library which is a well known Python tool, very useful for exploratory data analysis. Make sure you have your Jupyter Notebook opened before we start. If you are a beginner with that environment, you can have a look at how to get started with Jupyter Notebook.
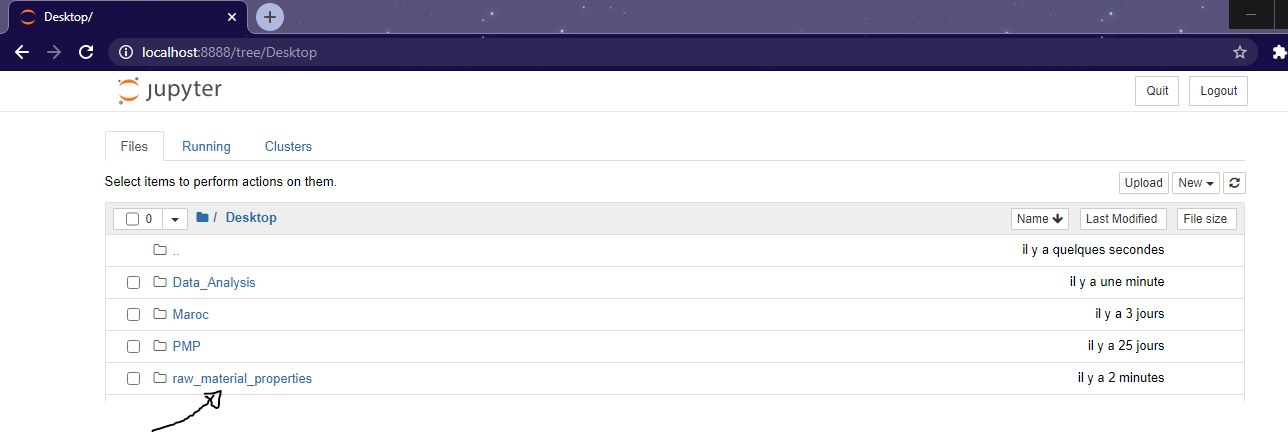
On my desktop, I have created the folder "raw_materials_properties" in which our dataset (a csv file) is and where we'll create another file.
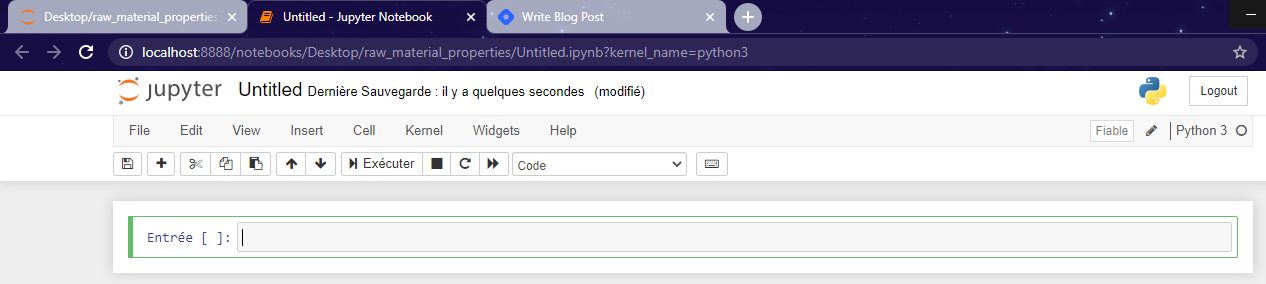
 Now, let's create a new Python3 file in our Jupyter Notebook environment and rename it as "MissingDataHandling.py". For that, click on New, then Python3; a new tab should appear with the new untitled Python file like on the picture below.
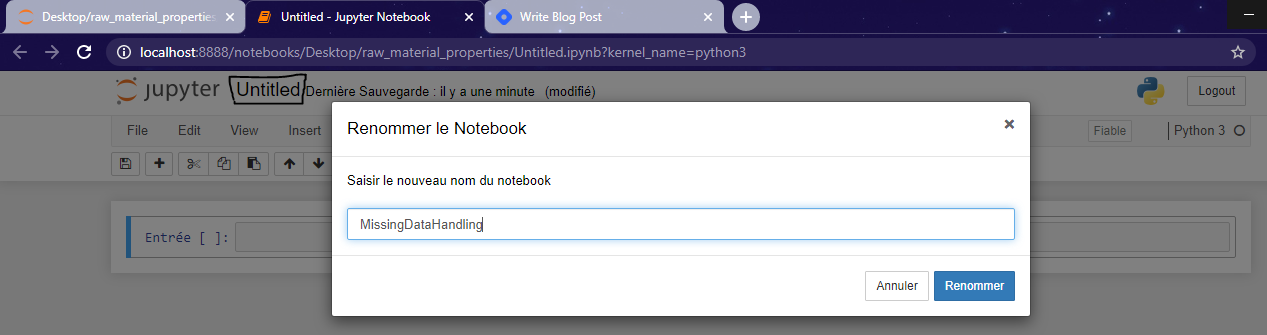
 To rename the file, click on "untitled", edit the new name in the popup window and click on rename (Mine is in French).
 Now that our environment is ready, let's import Pandas and use the appropriate method to show the basic structure of our dataset.
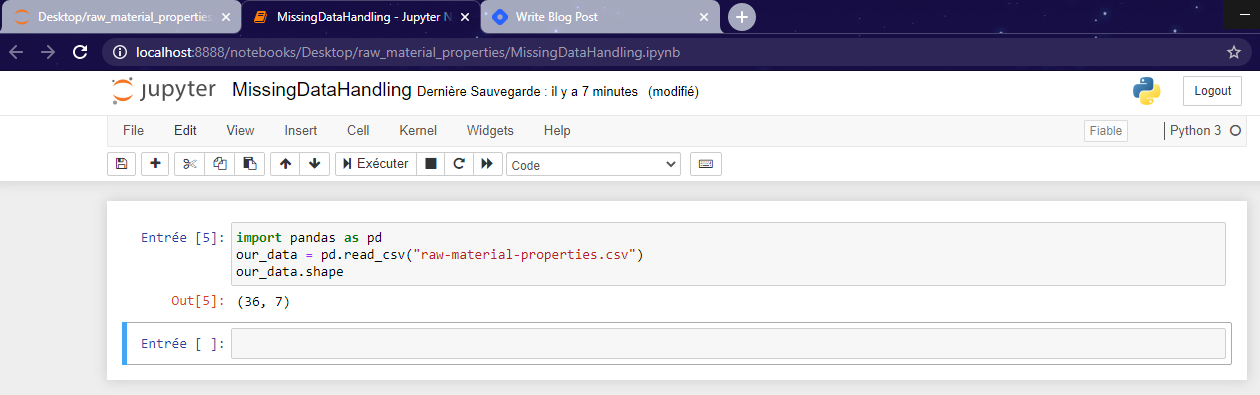 So basically, our dataset is made of 36 rows and 7 columns. Let's see the 10 first records of our file.
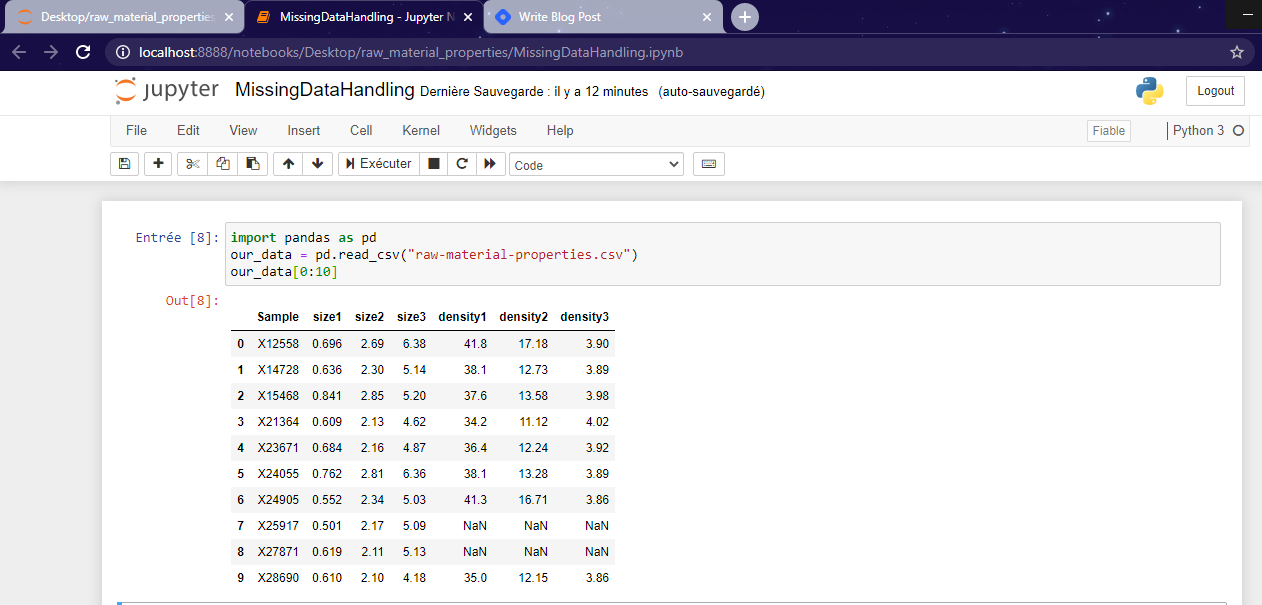 As you can notice, sometimes, in csv files, there are null values and Pandas use to display them as NaN in dataframes. And that's exactly on those null values we want to work in this tutorial.
The dropna() method
The first method we are going to learn is called dropna() and it removes the null values contained in a dataset.
Syntax
NameofDataFrame.dropna(axis=0, how='any', thresh=None, subset=None, inplace=False)
The meaning of each parameter
- axis: it takes int or string value for rows/columns. Input can be 0 or 1 for Integer and 'index' or 'columns' for String.
- how: it takes only two string values ('any' or 'all'). 'any' drops the row/column if ANY value is Null and 'all' drops only if ALL values are null.
- thresh: it takes integer value which tells minimum amount of null values to drop.
- subset: It’s an array which limits the dropping process to passed rows/columns through list.
- inplace: It's a boolean which makes the changes in data frame itself if its value is True.
We will see two examples of how to use the dropna() method. In the first one, we will drop all the rows that contains at least one null value.
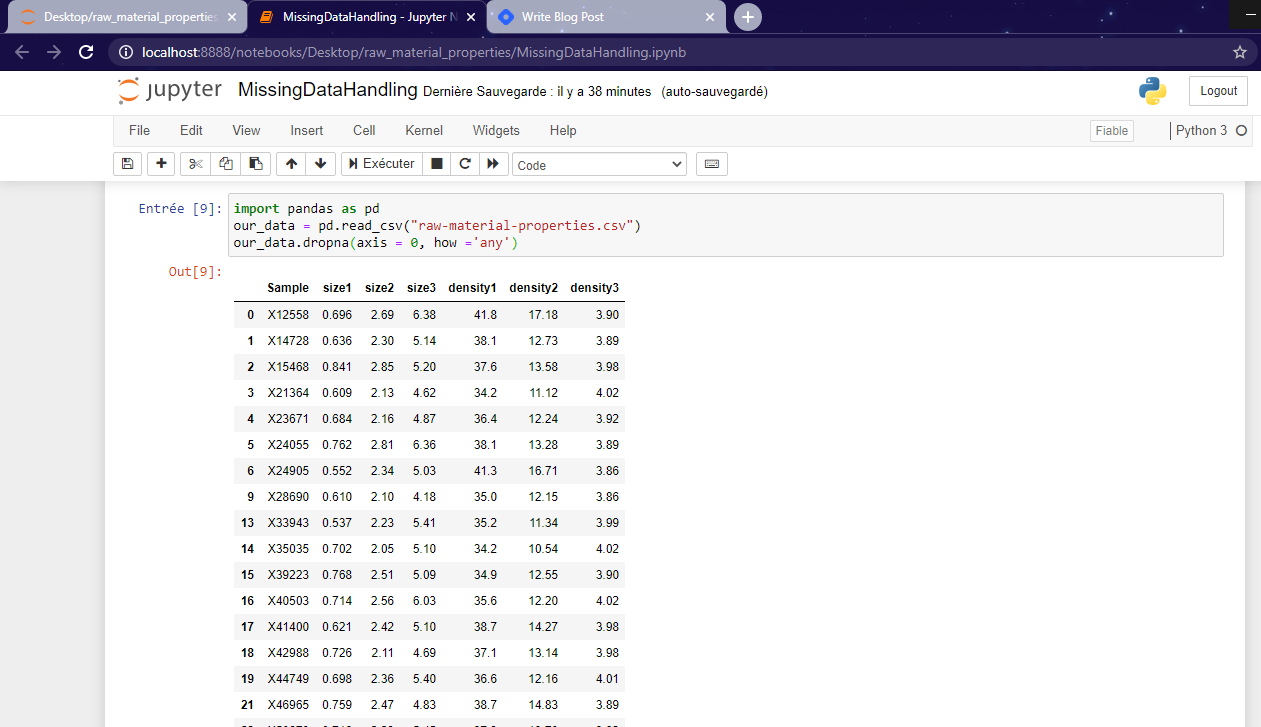
 As you can notice, the lines 7,8,10,11,12,20,22,24,29,34 are no more present. That means that the dropna() method works properly.
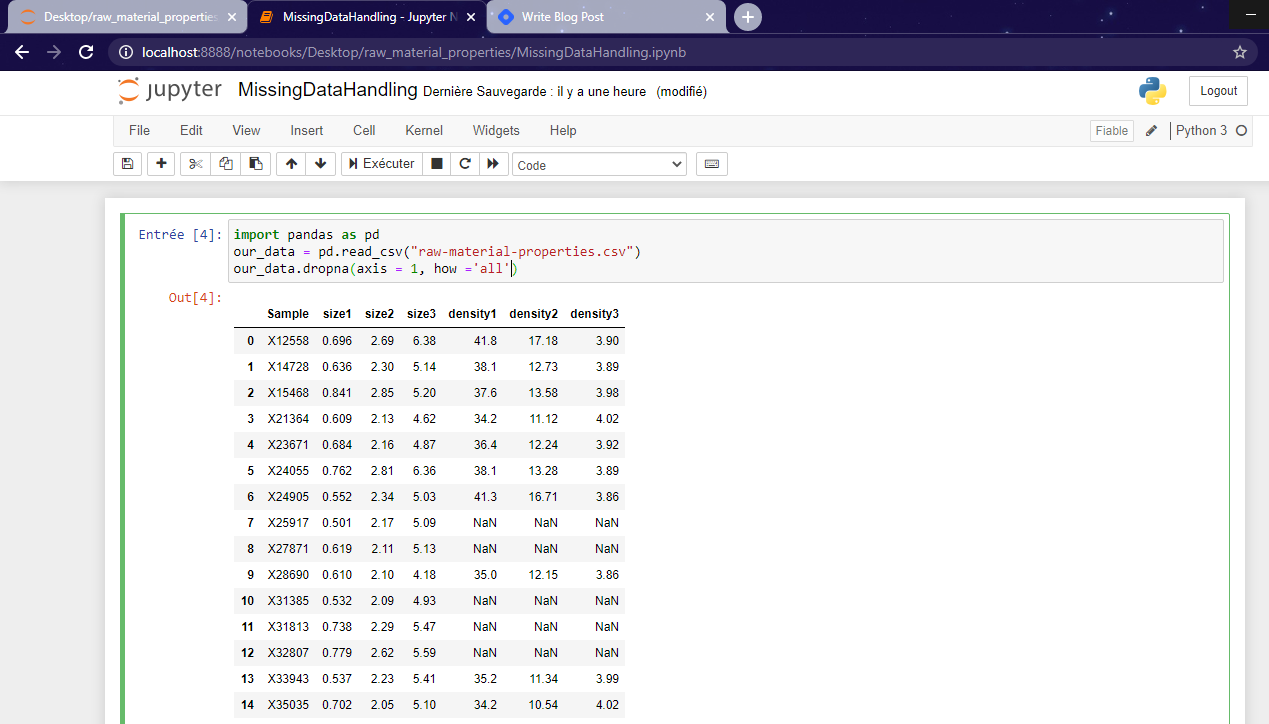
Now, let's see the second example through which we will delete rows using the parameter how ='all'. But remember,that method works only if the entire observation is null (If all the values on a given row/column are NaN). In our dataset, we don't have such lines or columns so we will create one column that contains only null values. Thus, we could apply the second example of dropna() easily.
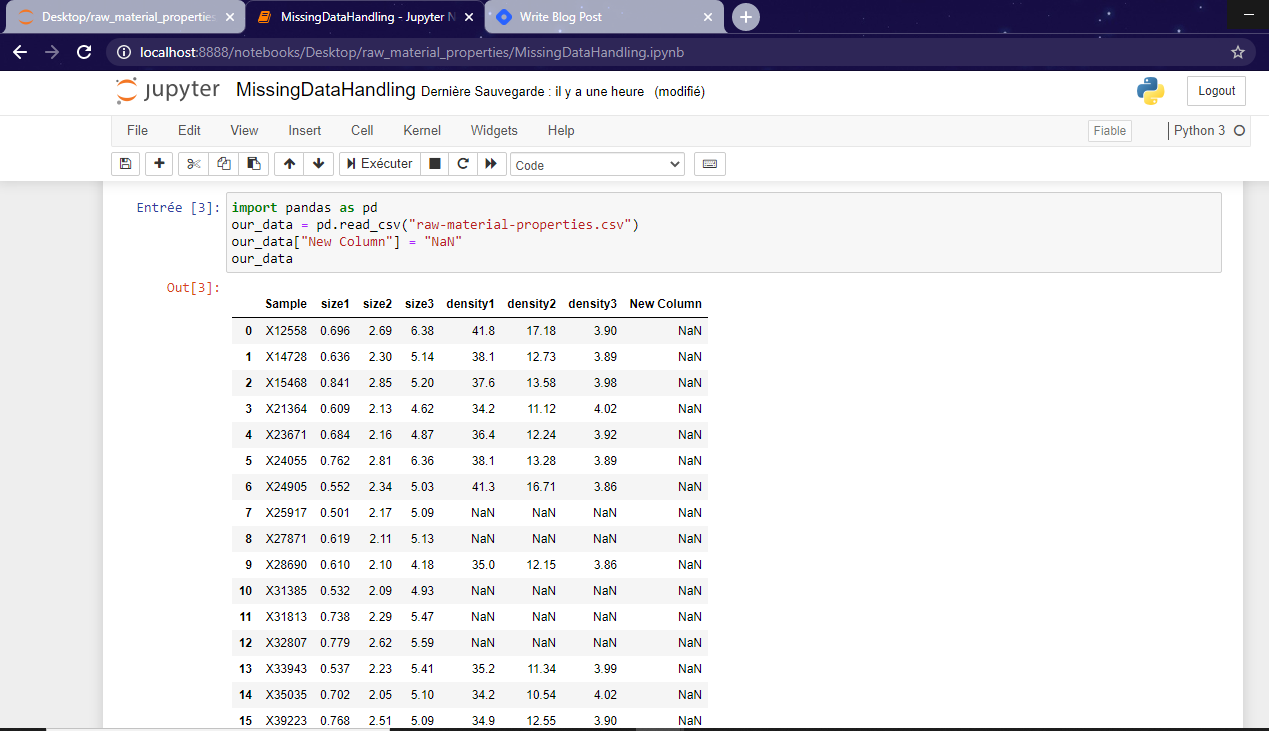 And if we run that line of code, then the column we have just created will simply disappear. Axis = 1 here means that the whole column will be deleted.
The fillna() method
The fillna() method manages in a way that the user replaces NaN values with his own values.
Syntax
NameofDataFrame.fillna(value=None, method=None, axis=None, inplace=False, limit=None, downcast=None, **kwargs)
What is the meaning of each parameter ?
- value : Static, dictionary, array, series or dataframe (any datatype) in order to replace the NaN.
- method : This parameter is used if the user doesn’t pass any value. With Pandas, there are methods such as bfill (backfill) or ffill(forwardfill) which fills the place with value in the Forward index or Previous/Back respectively.
- axis: same with the dropna().
- inplace: same with the dropna().
- limit : This is an integer value which specifies maximum number of consecutive forward/backward NaN values.
- downcast : It takes a dict which specifies what dtype (datatype) to downcast to which one.
- **kwargs : Any other keyword arguments.
For the fillna() method, we will see three simple use cases.
First example
Let's assume that we want to fill the the NaN values in the column "density1" by the value "No density1". And here we are !

Second example
Here, we are going to apply the ffill method to the fillna. Pay attention to the NaN values at lines 7,8,10,11 and 12. They will be replaced by the preceding values without any limit.
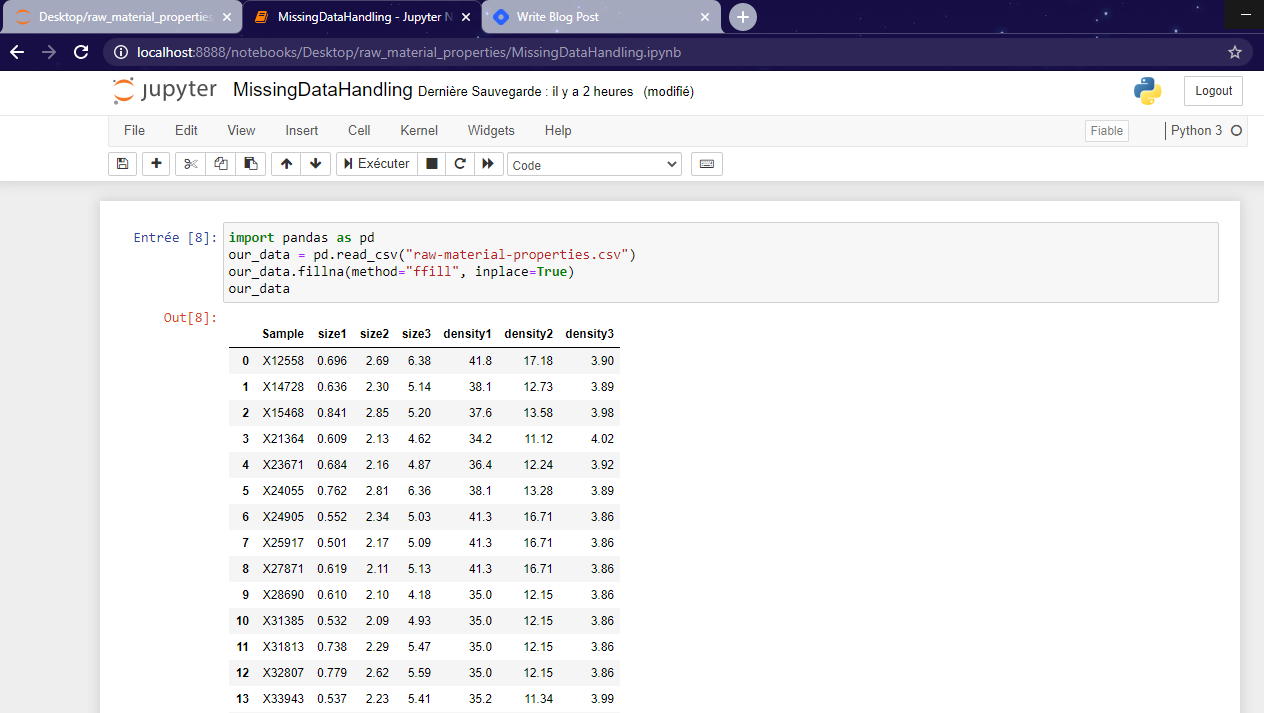 Have you noticed it ? Sure you have.
Third example
In this last example, we will fill the NaN values by replacing them with the respective preceding values but there's a limit.
 In our case, we set the limit at 1, that means not more than one NaN value each time the preceding value is different. You can try to set the limit at 2 or more and see the result.
Which one I recommend and why ?
Should I recommend using one instead of the other ?

I don't think so but the only thing I can say about the two methods is that dropna() seems to be better than fillna() as it doesn't alter the dataset (the real aspect of things, of data) but it reduces its shape, making then, less data available for analysis.
Personally, I think It's always better as a beginner in data science, to loose a few data than compromising the whole dataset by filling the missing values by our own values using fillna().
As I wrote up, this article is a reference for me and the beginners who are searching for solutions to deal with missing values in datasets.
Hope this will help someone !!
Enjoy Reading !!
References


